Latitude vs. Wind Speed
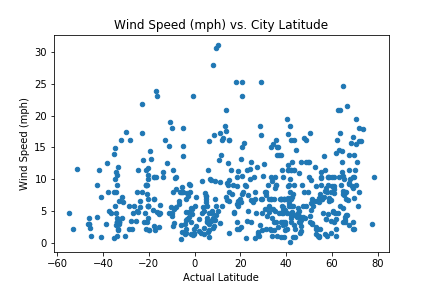
This plot shows how wind speed changes with respect to latitude. There does not appear to be a relationship between wind speed and latitude. Most of the wind speed measurements for the cities observed are below about 20 mph, with some possible outliers above that point. It may be useful to create a box and whisker plot of the wind speeds to determine if some of the highest values (around 30 mph) represent outliers in the data set, and to possibly examine which cities in the dataset have such high wind speeds and figure out what causes such high wind speeds for those cities.
Visualizations