Latitude vs. Humidity
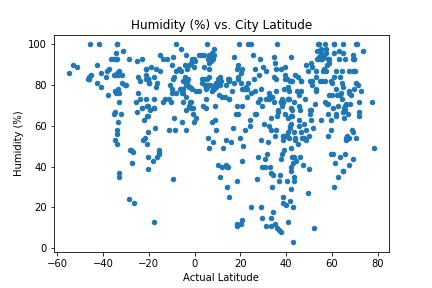
This plot shows how humidity changes with respect to latitude. There does not appear to be a relationship between humidity and latitude, since the data points are distributed relatively randomly across the humidity and latitude ranges. It was interesting to find that most of the cities had relatively high values of humidity when the data was collected from the OpenWeatherMap API, with most of the humidity values above approximately 60% for the cities observed in this study. For a relatively random distribution of data points, we would expect half of the data points to be above 50% humidity and half of them to be below 50% humidity, so there was possibly some kind of global or seasonal weather pattern affecting humidity values - or humidity values are just usually above 60% for many cities on Earth. This aspect of the data requires further research.
A better graph might show water saturation/content in the air (density or mass) because the same percentage humidity air can hold different amounts of water at different temperatures, where higher temperatures can hold more water in the air. So it might be easier to find trends or different results if the amount of water in the air is directly measured with units of mass, which should effectively normalize the data so the results are compared consistently across the same y-values and scales correctly.
Visualizations