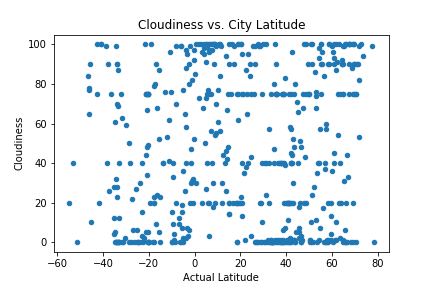
This plot shows how cloudiness changes with respect to latitude. There does not appear to be a relationship
between cloudiness and latitude, since there is a full range of cloudiness (0% to 100%) across all latitudes,
distributed relatively evenly. However, it is important to note that the data may not have high precision measurements of
cloudiness for some data points, because there appear to be horizontal groupings of data points across the latitudes
where the cloudiness value stays exactly the same. Some of these horizontal groupings, that almost appear to form
lines of data points, include cloudiness values of 0%, 20%, 40%, 75%, 90%, and 100%. It would be interesting to compare
these values to cloudiness values gathered from other data sources, to see if there are more exact measurements
available. However, the lack of relationship between cloudiness and latitude should remain, even with more precise data.