Latitude vs. Temperature
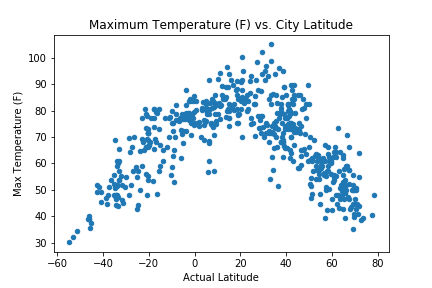
This plot shows how temperature changes with respect to latitude. The relationship between temperature and latitude looks like a downward-opening parabola with a peak maximum temperature of approximately 105 deg F at a latitude of about 35 degrees. However, looking at the general pattern of the temperature vs. latitude scatter plot points, they seem to reach consistent peak values at a latitude of approximately 20 degrees.
This plot can be further analyzed by splitting the data points by either northern/southern hemispheres (with all latitudes shown either above or below 0 degrees) to show the temperature trends above and below the equator, or it can be split by the tilt of the Earth's axis (approximately 23 degrees latitude). The latitude of the tilt of the Earth's axis shows the approximate maximums in peak temperatures for the cities observed, which makes sense, because the northern hemisphere is currently in summer, and the latitude that represents the closest points on earth to the sun is approximately 23 degrees.
Visualizations